'Knowledge' Makhluk seperti itu sebenarnya !!! dan Siapa Legenda Knowledge Management

KNOWLEDGE atau PENGETAHUAN yang berkali-kali kita bicarakan itu sebenarnya “makhluk” apa ?. Pengetahuan itu bisa dibagi menjadi dua (Nonaka 1992, dalam Saide 2015) :
Knowledge is Power (sumber: image)
1.Explicit Knowledge yakni pengetahuan yang tertulis, terarsip, tersebar (cetak maupun elektronik) dan bisa sebagai bahan pembelajaran (reference) untuk orang lain. Ketika seorang member milis memberi solusi dengan menulis di buku, maka sebenarnya itu adalah bentuk explicit knowledge.
2.Tacit Knowledge merupakan pengetahuan yang berbentuk knowhow, pengalaman, skill, pemahaman, maupun rules of thumb. Ketika seorang member milis menjawab berdasarkan pengalaman dia, hasil ngoprek atau tidak disengaja dapat solusi misalnya, itu semua adalah tacit knowledge. Tacit knowledge ini kadang susah kita ungkapkan atau kita tulis.

Contoh lainnya, seorang koki hebat kadang ketika menulis resep masakan, terpaksa menggunakan ungkapan “garam secukupnya” atau “gula secukupnya”. Soalnya memang dia sendiri tidak  pernah mengukur berapa gram itu garam dan gula, semua menggunakan know-how dan pengalaman selama sekian tahun memasak. Itulah mengapa Michael Polyani mengatakan bahwa pengetahuan kita jauh lebih banyak daripada yang kita ceritakan.

Ikujiro Nonaka (sumber: image)
Legenda knowledge management tentu tidak bisa kita lepaskan dari Ikujiro Nonaka dengan bukunya The Knowledge-Creating Company. Nonaka menceritakan bagaimana success story Matsushita Electric pada tahun 1985 ketika mengembangkan mesin pembuat roti. Konon pada era tahun 1985, Matsushita Electric menemui kesulitan besar dalam produksi mesin pembuat roti.

Mereka selalu gagal dalam percobaan yang dilakukan. Kulit luar roti yang sudah gosong padahal dalamnya masih mentah, pengaturan volume dan suhu yang tidak terformulasi, adalah pemandangan sehari-hari dari percobaan yang dilakukan. Adalah seorang pengembang software matsushita electric bernama Ikuko Tanaka yang akhirnya mempunyai ide cemerlang untuk pergi magang langsung ke pembuat roti ternama di Osaka International Hotel. Dia dibimbing langsung oleh sang pembuat roti ternama tersebut untuk belajar bagaimana mengembangkan adonan dan teknik khusus lainnya.

Ikujiro Nonaka (1998) dalam Saide (2015), membuat formulasi yang terkenal dengan sebutan SECI Model atau Knowledge Spiral. Konsepnya adalah sebagai berikut:  dalam siklus perjalanan kehidupan kita, pengetahuan itu mengalami proses yang kalau digambarkan berbentuk spiral, proses itu disebut dengan Socialization - Externalization Combination - Internalization.

1. Proses eksternalisasi (externalization), yaitu mengubah tacit knowledge yang kita miliki menjadi explicit knowledge. Bisa dengan menuliskan know-how dan pengalaman yang kita dapatkan dalam bentuk tulisan artikel atau bahkan buku apabila perlu. Dan tulisan tulisan tersebut akan sangat bermanfaat bagi orang lain yang sedang  memerlukannya.

2. Proses kombinasi (combination), yaitu memanfaatkan explicit knowledge yang ada untuk kita implementasikan menjadi explicit knowledge lain. Proses ini sangat berguna untuk meningkatkan skill dan produktivitas diri sendiri. Kita bisa menghubungkan dan  mengkombinasikan explicit knowledge yang ada menjadi explicit knowledge baru yang lebih bermanfaat.
SECI Model atau Knowledge Spiral (Nonaka, 1992)
sumber: http://www.sciencedirect.com/science/article/pii/S1877050915036315 (author: Saide, Mahendrwathi)
3. Proses internalisasi (internalization), yakni mengubah explicit knowledge sebagai inspirasi datangnya tacit knowledge. Dari keempat proses yang ada, mungkin hanya inilah yang telah kita lakukan. Bahasa lainnya adalah learning by doing. Dengan referensi dari manual dan buku yang ada, saya mulai bekerja, dan saya menemukan pengalaman baru, pemahaman baru dan know-how baru yang mungkin tidak saya dapatkan dari buku tersebut.

4. Proses sosialisasi (socialization), yakni mengubah tacit knowledge ke tacit knowledge lain. Ini adalah hal yang juga terkadang sering kita lupakan. Kita tidak manfaatkan keberadaan kita pada suatu pekerjaan untuk belajar dari orang lain, yang mungkin lebih berpengalaman. Proses ini membuat pengetahuan kita terasah dan juga penting untuk peningkatan diri sendiri. Yang tentu saja ini nanti akan berputar pada proses pertama yaitu eksternalisasi. Semakin sukses kita menjalani proses perolehan tacit knowledge baru, semakin banyak explicit knowledge yang
berhasil kita produksi pada proses eksternalisasi.


References:
1. Saide & Mehendrawathi(2015). Knowledge Management Support For Enterprise Resource Planning Implementation. Procedia - Procedia Computer Science, 00, 1–8. http://doi.org/10.1016/j.procs.2015.12.170. 
2. Saide & Rozanda, N. E. (2013). Analisis kebutuhan manajemen pengetahuan pada perusahaan perbankan 1, 343–351. 
3. Nonaka I & Konno N. The Concept of BA: Building A Fondat ion for Knowledge Creation. California Management Review. pp. 40-55. 1998. 
4.  Takeuchi, H. (2005). The New Dynamism of the Knowledge-Creating Company, 1–10.
5.  Nonaka, Ikujiro, and Hirotaka Takeuchi. 1995. The Knowledge-Creating Company: How Japanese Companies Create the Dynamics of Innovation. Oxford University Press

0 komentar:

'Merantaulah hingga tersesat berkali-kali'

"Merantaulah hingga tersesat berkali-kali, itulah cara terbaik untuk menemukan jati diri”. Hingga akhirnya saya temukan rasa ini "bukan perusahan/instansi mana yang kita tuju, tapi leader mana yang kita pilih (kita yang pilih)".


Diri ini telah dan sangat beruntung untuk bisa merasakan begitu banyak cinta, hanya bisa mengatakan terima kasih dan tahu bahwa selalu membawanya dalam hati. (terima kasih berarti mengakui bahwa kita tidak bisa hidup tanpa orang lain)


Persis 17 tahun silam. Teman teman, baru baru ini saya mendengar cerita singkat nan pelik dari teman yang dulu mengikutai kegiatan bakti sosial di kaki gunung semeru jawa timur. Dia mendapati seorang anak yang sedang bermain bola dan bertanya "Adik, adik mau jadi apa kalau sudah besar ?". Si adik menjawab "biar aku jadi petani seperi ayah saja, Om". Dalam benak saya, Sekejam apa negara kita sampai anak se kecil itu tidak berani untuk bermimpi, Sekejam Apa :( :( :( !!!. ini persis 17 tahun silam saya alami. 


Kami ingin terus tumbuh secara personal dan profesional sehingga di masa depan mudah-mudahan Kami bisa kembali ke kampung halaman dan memberikan kembali segala sesuatu yang telah diberikan kepada Kami selama tahun-tahun tak terlupakan. Kami dapat belajar tentang passion dan semangat, belajar tentang mimpi, mempelajari banyak hal dalam satu waktu. Bukan perusahaan mana yang saya tuju, tapi Leader mana yang saya pilih. Leader yang baik mengajarkan dengan cara berbeda.


Semuanya sangat bermanfaat untuk kami, pelajar rantauan, yang hingga kini masih merangkai jalan titik temu antara diri ini dengan ilmu yang dikais. Meniti kehidupan di tanah rantauan. Ya, Diri ini masih mencari, meretas jalan. Sementara waktu, nantikan kami dengan berdo’a di hadapan kerahiban-Nya, semoga kami segera kembali untuk kampung, untuk Agama dan pasti untuk Indonesia merdeka.


0 komentar:

Reliability and Validity using SmartPLS 2.0

In the previous tutorial about CFA or Confirmatory Factor Analysis using SmartPLS, the tutorial is all about how to start a project and do the CFA. And this time, I will explain how to do reliability checking of the data after CFA is performed. So then, we can see the hypotheses are significant or not.

After do the confirmatory factor analysis, you can do a further analysis using Bootstrapping Method... click on the bootstrap menu on the top menu.


You can see a dialog box...but just click Finish...


Then your values will be different than before...


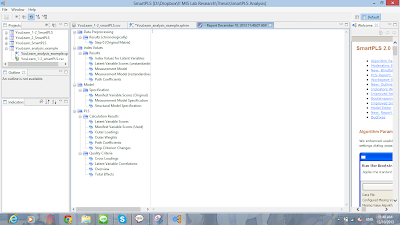
If you want to see the full report, you must click Report then a report window will appear...


In here you see the t-value of each items... click in the Bootstrapping - Outer Loadings


And also in here you can see the t-value of each path coefficient in the Bootstrapping - Path Coefficients (Mean, STDEV, T-values)


But those method not enough... you need to evaluate again using SmartPLS Algorithm again....


Then, you can see the values change again... :p But it's not a loadings... it is a path coefficient...


Open the report and this report is for your final results...let's take a look....


in the path coefficient, you can see the value of coefficient...

In the Latent Variable Correlation, you can see the correlation matrix. Based on the Cornell and Larcker research, the correlation between the same variables (Ci - Ci = 1) need to be changed to the square root of the AVE values and the result need to be greater than other correlation between that variables with other variables...
Example :
AVE CI = 0.87
maybe for example only the square root of 0.87 is 0.97...
So, you can see the other correlation between CI and E, CI and PEOU, and CI and EU are less than 0.97... means the data are reliable...


To see the AVE, you can see in the overview...


So, if you want to know your path or relationship or the line between variables or sometimes called hypotheses are significant or not...you need to make this kind of table...


Beta is the path significant...
T-value...you already have it right?
Then, how to know it's significant?

You can see there are some p that less than 0.001 , 0.01, or 0.05... it is one-tailed t-test...
you need to know what your df... if your data is 55...your df is 54...
Then, the (*) in the p is the significant level...
Open your excel and make this equation

= TINV(p, df)

Example : = TINV(0.01, 54) ... then ENTER... the result is 2.6699
Means that the 0.01 significant level or p < 0.01, requires a t-value > 2.6699

As you can see in the table, the t-value of 3rd row is 2.2378... it is less than 2.6699... So, it's not significant... then Hypotheses is not supported...

Okay...that's the end of the tutorial....if you have anything to ask, feel free to ask me... I'll be happy to help you...hope this information will be useful to you... ^^

Reference: http://intandzikria.blogspot.tw/2013/12/reliability-and-validity-using-smartpls.html 

0 komentar:

Confirmatory Factor Analysis SmartPLS 2.0

Confirmatory Factor Analysis (CFA) is a method used to get value from several factors that affect data and whether the data itself is approriate to do next analysis. Many softwares can be used to perform CFA. But, if your data are less than 200, then it's better to use SmartPLS. If more, you can use SPSS or AMOS. Usually, many research used more than one software to perfom quantitave analysis.


This time, I want to make tutorial on hoq to perform CFA using SmartPLS. It is a free software which can be downloaded from its website. The free version is only the 2.0 version. The 3rd version is not free because you have to buy the license, even for the students the functionality are limited. 
We start with creating a new project
Click FILE - NEW - CREATE NEW PROJECT


You will see a dialog box to input your project name ... then click NEXT


Choose your project file. The type file that associate with SmartPLS is only .csv ... So, prepare the .csv file. If you want, you can convert your data from SPSS to .csv file... Then, click OK.


You will see in the PROJECTS area your new project which have two things... .splsm and .csv file... .csv file is your raw data which need to be analyzed...


and .splsm is the file which you can use for making your data model and do analysis...


Look at the menu in the top of the window.... Tere is a blue circle with + in the corner... It is used for insertion mode to build several factors in your model.


Click on the .splsm window and there will be several circles which you can use for factors in your model...


You also can rename the circle...just do the right click - rename variables or press F2 on your keyboard...


Let's see in the left of the window...there are several indicators from your raw data...drag your indicators to its factor variables....


You can change the position of the indicators with right click on the variable and click Align Top, Bottom, Left, or Right


Then, how to make the relationship? look beside the circle with + icon... there is a two circle icon which related each other using a line... click that icon...


And make relationship between variables... the orange circle will be changed to blue color...and ready to be analyzed...


For the first analysis... click on the PLS Algorithm in the menu....


Then you will see a dialog box...just click Finish....


Then you can see the result... in the relationship line, you can see there are several values. That values represent the factor loadings of the data...


If you want to see the full report, click on the report on the menu....


You will see a new window open that represent the result...but how to read it?


To see the factor loadings, click on the PLS- Calculatin Result - Outer Loadings
There will be several correlation and you can see the value of each factors. Sometimes, the value need to be more than 0.7 or 0.65... if you have an item that the value is less than 0.7 or 0.65, you need to eliminate it from your model for further analysis because it's not significant enough.


Then, you can also see the AVE value, composite reliability, R square, cronbach alpha, and other... in the Overview...


So..you can see all of the things that need to be seen in the CFA... maybe yes it's not easy to see...you need to move those values to excel and move it to appropriate tables than everyone can see your result easily..

Hope this tutorial help you and if you have any questions, feel free to ask me...i'll be happy to help you.. ^^

Reference: http://intandzikria.blogspot.tw/2013/12/confirmatory-factor-analysis-smartpls.html

0 komentar: